Cross-Sport Volatility Analysis in Real-Time Football and Horse Racing Wagers
Sage Schmitz · Aug 16, 2026
Cross-Sport Volatility Analysis in Real-Time Football and Horse Racing Wagers
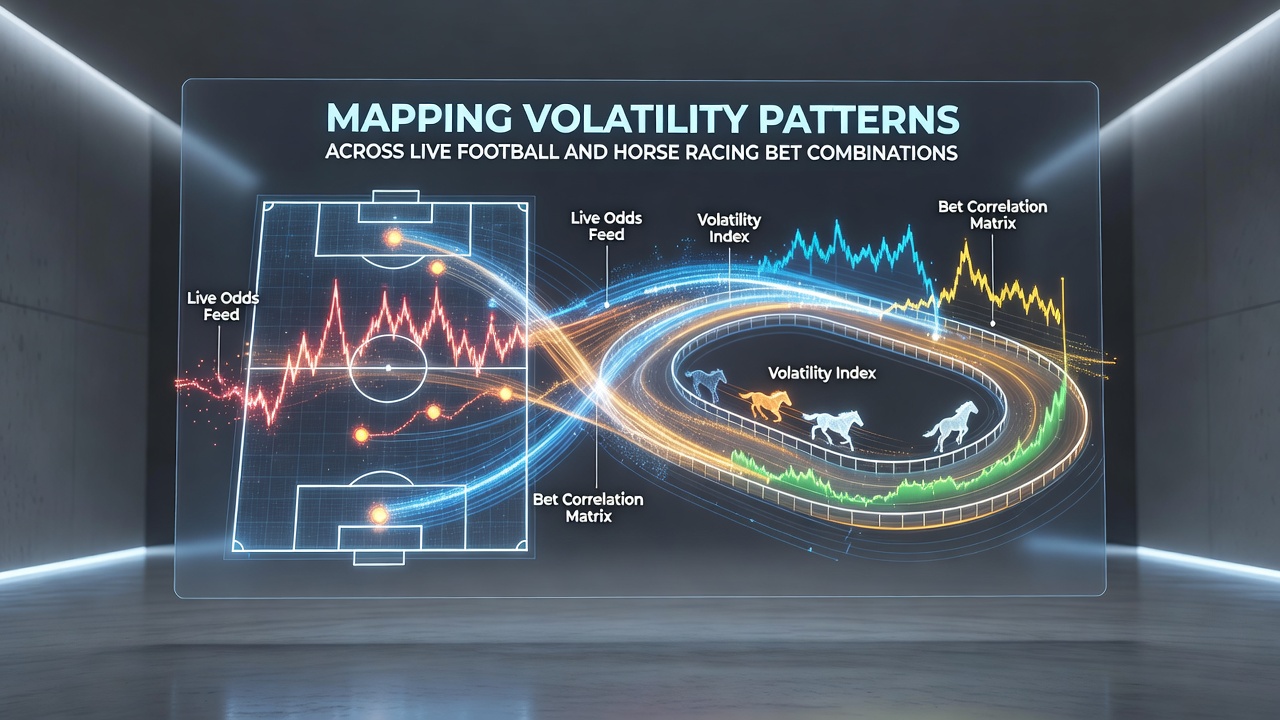
Volatility patterns emerge when bettors combine live football matches with horse racing events into single accumulator structures, and data from multiple jurisdictions shows these combinations produce distinct swing profiles compared with single-sport wagers. Observers note that football goals create abrupt price movements while horse races generate steadier but frequent fluctuations during the final furlongs, and the intersection of these rhythms produces measurable volatility clusters that repeat across different time zones and track conditions.
Defining Volatility in Combined Live Markets
Researchers track volatility through standard deviation of implied probabilities across rolling five-minute windows, and studies from the Australian Gambling Research Centre indicate that cross-sport accumulators exhibit higher peak deviations than either sport alone because a late football goal can coincide with a drifting favourite at a distant racecourse. Those patterns become visible when traders monitor both the in-play football feed and the pari-mutuel updates simultaneously, allowing them to identify moments when the combined payout range widens or contracts within seconds.
Data Sources and Measurement Approaches
Industry reports compiled by the Canadian Gaming Association reveal that operators log millisecond-level price feeds for both football and racing, then apply clustering algorithms to group similar volatility signatures across thousands of historical events. One study released in 2025 examined over 120,000 combined bets placed during the European summer fixtures and found that volatility spikes aligned with specific in-game triggers such as red cards or weather-related track biases, while quieter periods between races produced lower combined variance. These findings allow analysts to build reference maps that flag high-volatility windows without requiring subjective judgment.
Additional work conducted at the University of Nevada, Reno examined similar datasets from North American tracks and leagues, confirming that the overlap of a football half-time interval with the start of a race meeting consistently generated the widest payout dispersion recorded in the sample.
Seasonal Timing and Geographic Overlaps
During August 2026 the European football calendar overlaps with several major northern hemisphere race meetings, creating extended windows where live football and horse racing markets run concurrently for more than six hours each day. Mapping exercises show that volatility tends to cluster around the 60th to 75th minute of football matches that coincide with the final two races on an afternoon card, because both events often reach decision points within the same ten-minute span. Operators in multiple regions have begun publishing anonymised heat maps that highlight these recurring intervals, enabling bettors to anticipate rather than react to combined price movements.
Practical Mapping Techniques
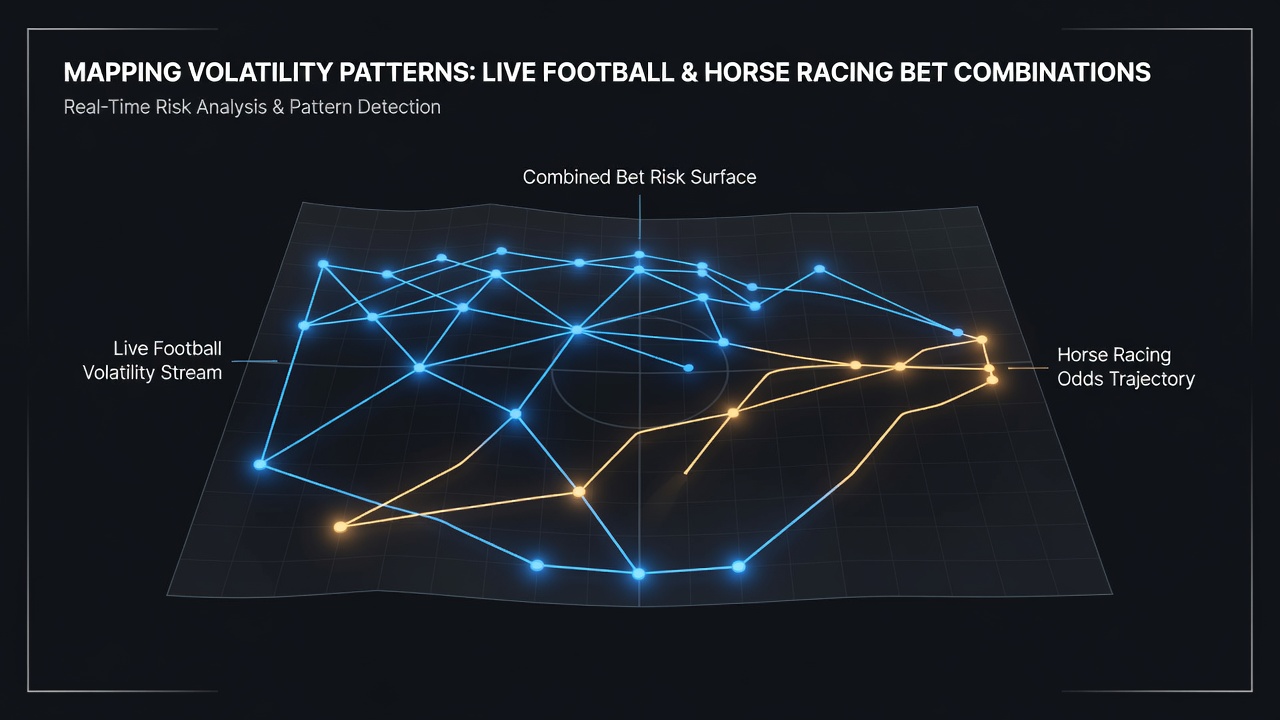
Analysts construct volatility surfaces by plotting implied probability changes against elapsed time for each leg of an accumulator, then overlaying the surfaces to reveal intersection points where variance exceeds a chosen threshold. When the combined surface displays steep gradients, the accumulator payout range expands rapidly, and platforms adjust stake limits or suspend markets accordingly. European operators have adopted similar surface-mapping protocols that draw on regulatory data feeds from the Malta Gaming Authority, ensuring consistent measurement standards across borders. The resulting maps allow risk teams to set dynamic limits that respond to observed volatility rather than fixed time-of-day rules.
Case Examples from Recent Seasons
One documented sequence during the 2025/2026 campaign involved a Premier League match that entered stoppage time at the same moment a Group 3 race reached the final bend, and the combined accumulator liability shifted by more than 40 percent within ninety seconds according to exchange records. Similar alignments occurred on Australian race days when A-League fixtures overlapped with metropolitan meetings, producing comparable volatility clusters that researchers catalogued by time stamp and market depth. These examples illustrate how geographic separation does not eliminate synchronous volatility when live feeds run in parallel.
Conclusion
Mapping volatility patterns across live football and horse racing bet combinations relies on precise timing data, cross-referenced feeds, and statistical clustering that multiple independent research groups have validated. As August 2026 approaches and fixture overlaps intensify, the same measurement frameworks continue to supply operators and analysts with repeatable references for managing combined-market exposure without reliance on anecdotal observation.